
Azure · Database · Desempenho · SQL
Azure SQL Database Performance Analysis
Everyone has been frustrated with slow applications and there was no way to discover what might be happening, because apparently everything was normal.
Have you considered performing a performance analysis for Azure SQL Database?
Performance Analysis
The analysis identifies queries that consume more resources and have longer execution times, helping to locate queries that need optimization.
This type of analysis can be performed on databases in standalone mode or when they are part of an Elastic Pool.
However, it is worth noting that to use this feature, the Query Store must be active on your database. By default, it is automatically enabled on all databases in Azure SQL.
Permissions
To access Performance Analysis (Query Performance Insights), you need one of the following Azure RBAC permissions:
- To access top queries and resource-intensive charts
- Reader (Reader)
- Owner (Owner)
- Contributor (Contributor)
- SQL DB Contributor (SQL DB Contributor)
- SQL Server Contributor (SQL Server Contributor)
- To display the query text
- Owner
- Contributor
- SQL DB Contributor
- SQL Server Contributor
Accessing Query Performance Insight
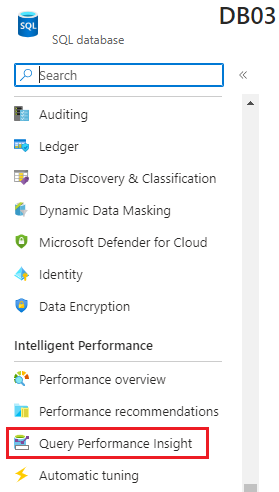
With the database you want to inspect open, go to the left menu, look for Intelligent Performance and access Query Performance Insight
On the right side, a chart will load showing the five queries that consume the most resources, along with the list containing each of the queries (queries) to obtain more detailed information about each one
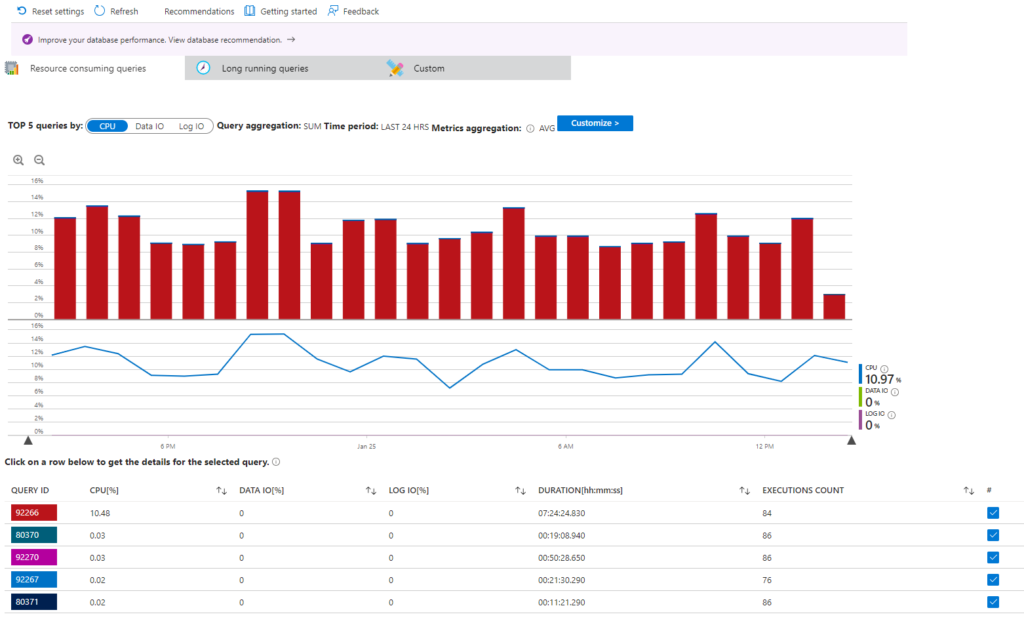
Analyzing the chart, it becomes clear, in this scenario, that the resource-heavy query is the one in red, so we will select it to display the analysis in detail.
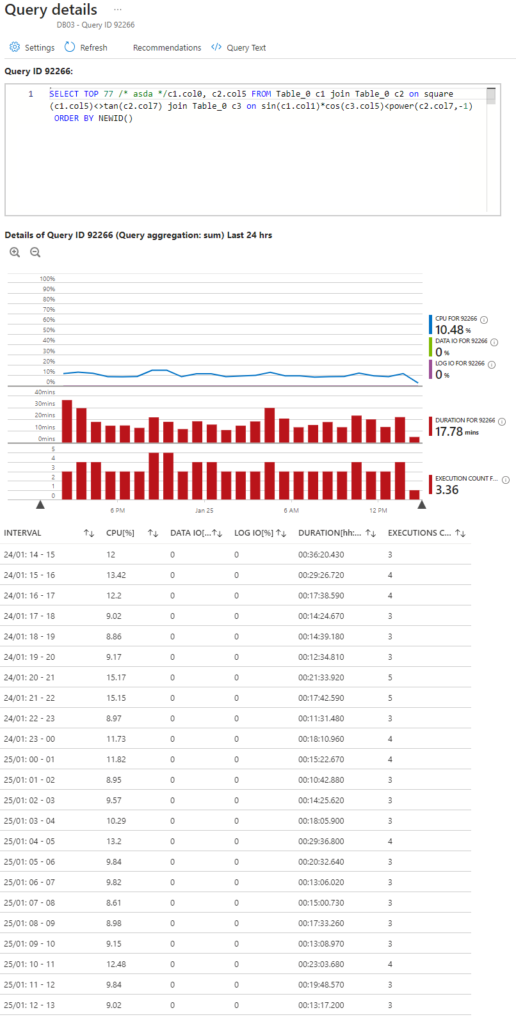
- The first chart shows the overall percentage of CPU used
- The middle chart shows the total duration of the query
- Finally, the total number of executions of the query
And, at the bottom of the page, you can also check the CPU, Data I/O, Log I/O, the time spent executing the query, and the number of times it was executed during that period by hour interval.
With this visualization, you can analyze and determine whether there is any bottleneck that the database might be causing to your application
References:
- https://learn.microsoft.com/pt-br/azure/azure-sql/database/single-database-overview?view=azuresql
- https://learn.microsoft.com/pt-br/azure/azure-sql/database/elastic-pool-overview?view=azuresql
- https://learn.microsoft.com/pt-br/sql/relational-databases/performance/monitoring-performance-by-using-the-query-store?view=sql-server-ver16
- https://learn.microsoft.com/pt-br/azure/role-based-access-control/overview